

"For home prices, there are two different methods used to compare home prices over different time periods: year-over-year (Y-O-Y) and month-over-month (M-O-M). Here's an explanation of each."
Media coverage about what’s happening with home prices can be confusing. A large part of that is due to the type of data being used and what they’re choosing to draw attention to. For home prices, there are two different methods used to compare home prices over different time periods: year-over-year (Y-O-Y) and month-over-month (M-O-M). Here's an explanation of each.
Year-over-Year (Y-O-Y):
- This comparison measures the change in home prices from the same month or quarter in the previous year. For example, if you're comparing Y-O-Y home prices for April 2023, you would compare them to the home prices for April 2022.
- Y-O-Y comparisons focus on changes over a one-year period, providing a more comprehensive view of long-term trends. They are usually useful for evaluating annual growth rates and determining if the market is generally appreciating or depreciating.
Month-over-Month (M-O-M):
- This comparison measures the change in home prices from one month to the next. For instance, if you're comparing M-O-M home prices for April 2023, you would compare them to the home prices for March 2023.
- Meanwhile, M-O-M comparisons analyze changes within a single month, giving a more immediate snapshot of short-term movements and price fluctuations. They are often used to track immediate shifts in demand and supply, seasonal trends, or the impact of specific events on the housing market.
The key difference between Y-O-Y and M-O-M comparisons lies in the time frame being assessed. Both approaches have their own merits and serve different purposes depending on the specific analysis required.
Why Is This Distinction So Important Right Now?
We’re about to enter a few months when home prices could possibly be lower than they were the same month last year. April, May, and June of 2022 were three of the best months for home prices in the history of the American housing market. Those same months this year might not measure up. That means, the Y-O-Y comparison will probably show values are depreciating. The numbers for April seem to suggest that’s what we’ll see in the months ahead (see graph below):
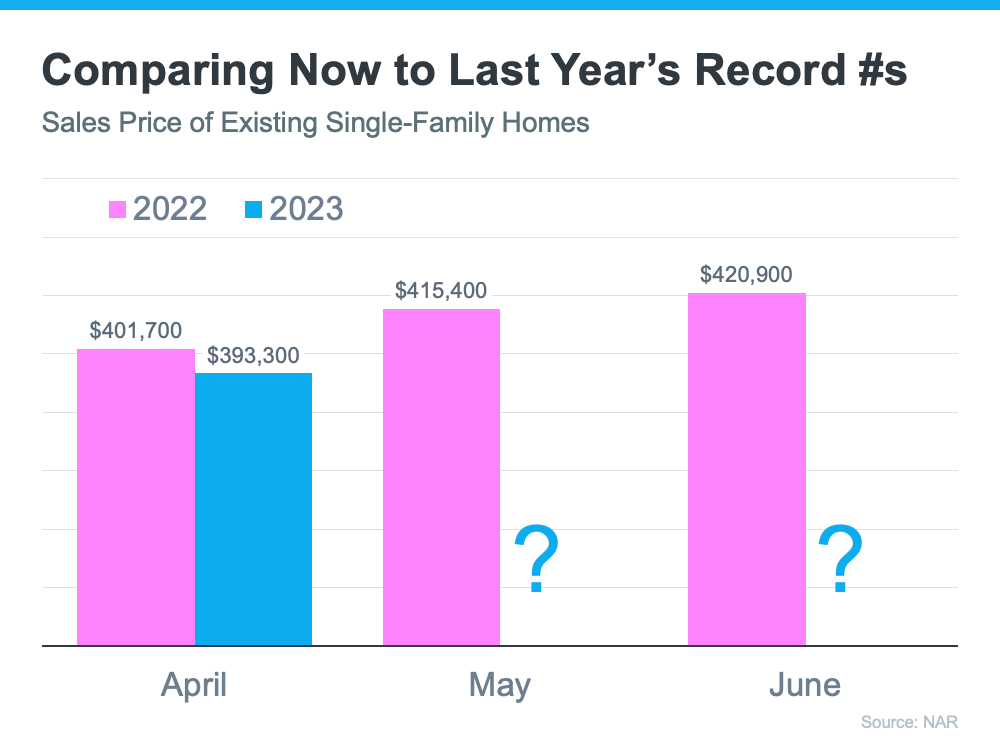
That’ll generate troubling headlines that say home values are falling. That’ll be accurate on a Y-O-Y basis. And, those headlines will lead many consumers to believe that home values are currently cascading downward.
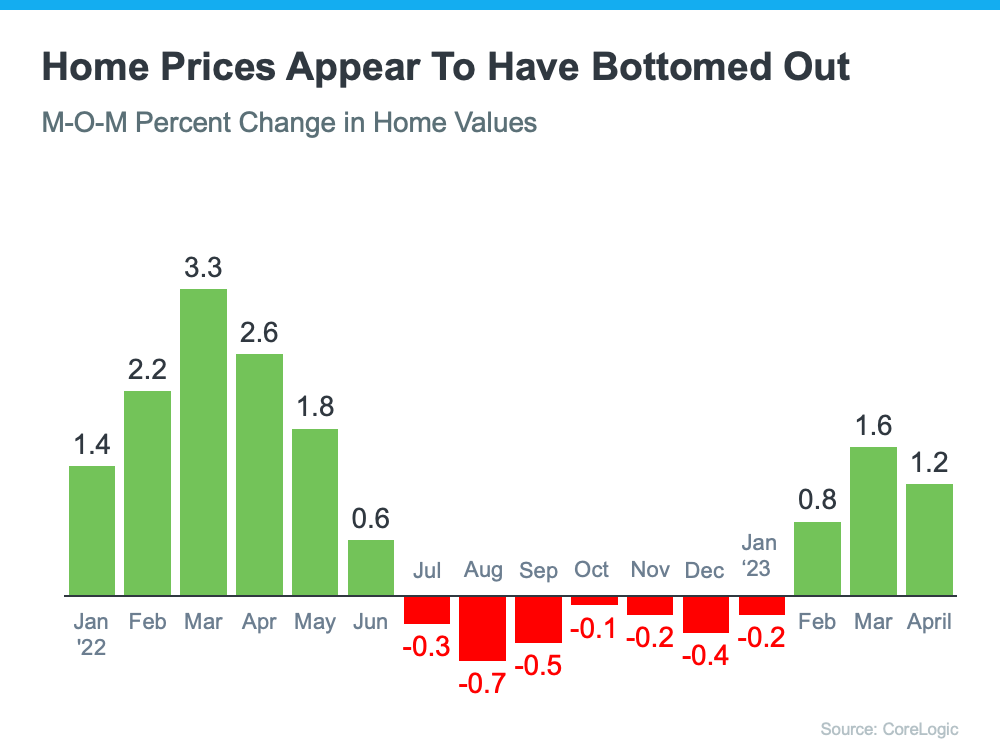
However, on a closer look at M-O-M home prices, we can see prices have actually been appreciating for the last several months. Those M-O-M numbers more accurately reflect what’s truly happening with home values: after several months of depreciation, it appears we’ve hit bottom and are bouncing back.
Here’s an example of M-O-M home price movements for the last 16 months from the CoreLogic Home Price Insights report (see graph below):
Why Does This Matter to You?
So, if you’re hearing negative headlines about home prices, remember they may not be painting the full picture. For the next few months, we’ll be comparing prices to last year’s record peak, and that may make the Y-O-Y comparison feel more negative. But, if we look at the more immediate, M-O-M trends, we can see home prices are actually on the way back up.
There’s an advantage to buying a home now. You’ll buy at a discount from last year’s price and before prices start to pick up even more momentum. It’s called “buying at the bottom,” and that’s a good thing.
Bottom Line
If you have questions about what’s happening with home prices, or if you’re ready to buy before prices climb higher, let’s connect.
To view original article, visit Keeping Current Matters.

Selling This Fall? You Want To Get These 4 Things Right.
Selling your house this fall is absolutely doable. Buyer activity typically starts to slow while the number of homes for sale climb – and you need the right strategy to get attention in this type of market.

Selling This Fall? You Haven’t Missed Your Window
Getting your house sold this season comes down to how well it’s priced and presented, and that’s where a local agent shines.

Thinking About Tapping into Your 401(k) To Buy a Home? Read This First.
No matter which route you take, talk with a financial expert first. The buyers who come out ahead build a solid plan with the right professionals before starting their journey to homeownership.

Most Home Sales Close – Here’s How To Keep Yours on Track
Some reasons are outside a seller’s control, like whether a buyer’s loan clears or whether they sell their own home in time. But there are a few proactive things you can do to help make sure your sale goes as smoothly as possible.

Selling a Luxury House? Here’s Why Now Is a Good Time
High-end buyers tend to feel less of the affordability pressure weighing on many households today, so they keep buying even when the wider market slows.

More Homes, Better Prices: A Buyer’s Summer
Sellers are reading market conditions and are pricing accordingly from the start rather than listing high and cutting later, and buyers are taking note and making bids.