
“For home prices, there are two different methods used to compare home prices over different time periods: year-over-year (Y-O-Y) and month-over-month (M-O-M). Here’s an explanation of each.”
Media coverage about what’s happening with home prices can be confusing. A large part of that is due to the type of data being used and what they’re choosing to draw attention to. For home prices, there are two different methods used to compare home prices over different time periods: year-over-year (Y-O-Y) and month-over-month (M-O-M). Here’s an explanation of each.
Year-over-Year (Y-O-Y):
- This comparison measures the change in home prices from the same month or quarter in the previous year. For example, if you’re comparing Y-O-Y home prices for April 2023, you would compare them to the home prices for April 2022.
- Y-O-Y comparisons focus on changes over a one-year period, providing a more comprehensive view of long-term trends. They are usually useful for evaluating annual growth rates and determining if the market is generally appreciating or depreciating.
Month-over-Month (M-O-M):
- This comparison measures the change in home prices from one month to the next. For instance, if you’re comparing M-O-M home prices for April 2023, you would compare them to the home prices for March 2023.
- Meanwhile, M-O-M comparisons analyze changes within a single month, giving a more immediate snapshot of short-term movements and price fluctuations. They are often used to track immediate shifts in demand and supply, seasonal trends, or the impact of specific events on the housing market.
The key difference between Y-O-Y and M-O-M comparisons lies in the time frame being assessed. Both approaches have their own merits and serve different purposes depending on the specific analysis required.
Why Is This Distinction So Important Right Now?
We’re about to enter a few months when home prices could possibly be lower than they were the same month last year. April, May, and June of 2022 were three of the best months for home prices in the history of the American housing market. Those same months this year might not measure up. That means, the Y-O-Y comparison will probably show values are depreciating. The numbers for April seem to suggest that’s what we’ll see in the months ahead (see graph below):
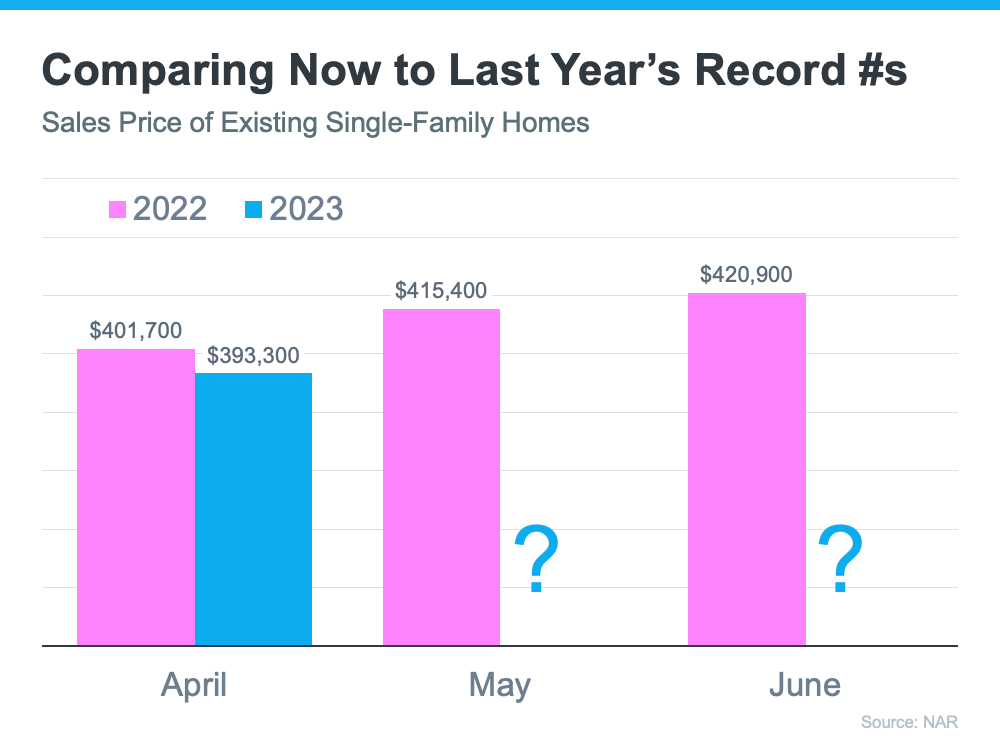
That’ll generate troubling headlines that say home values are falling. That’ll be accurate on a Y-O-Y basis. And, those headlines will lead many consumers to believe that home values are currently cascading downward.
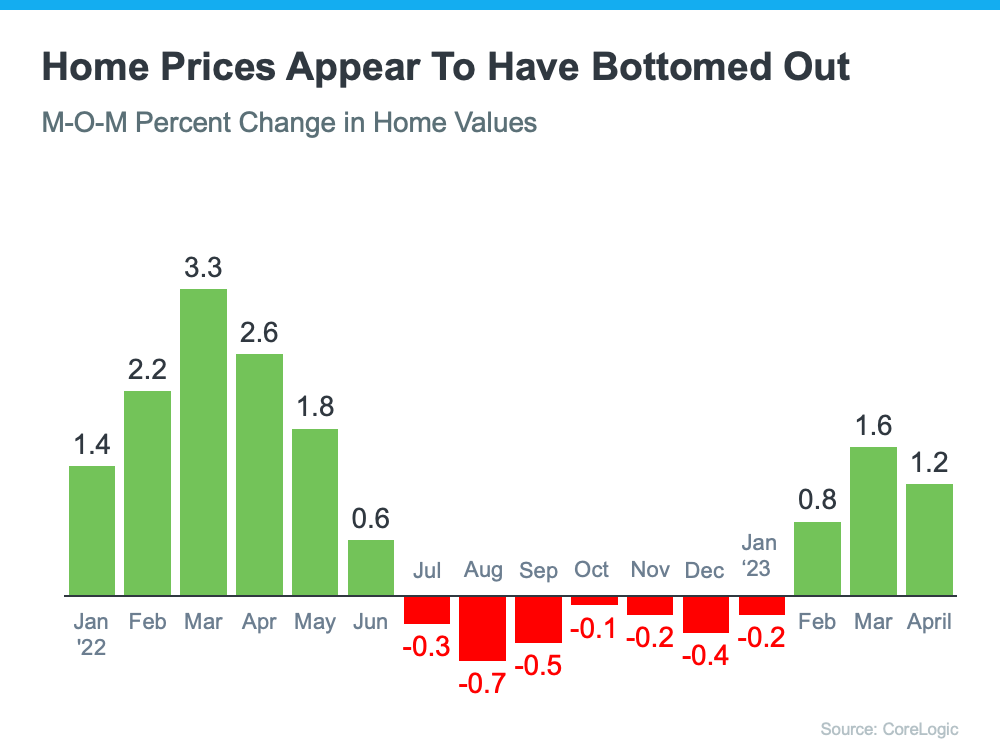
However, on a closer look at M-O-M home prices, we can see prices have actually been appreciating for the last several months. Those M-O-M numbers more accurately reflect what’s truly happening with home values: after several months of depreciation, it appears we’ve hit bottom and are bouncing back.
Here’s an example of M-O-M home price movements for the last 16 months from the CoreLogic Home Price Insights report (see graph below):
Why Does This Matter to You?
So, if you’re hearing negative headlines about home prices, remember they may not be painting the full picture. For the next few months, we’ll be comparing prices to last year’s record peak, and that may make the Y-O-Y comparison feel more negative. But, if we look at the more immediate, M-O-M trends, we can see home prices are actually on the way back up.
There’s an advantage to buying a home now. You’ll buy at a discount from last year’s price and before prices start to pick up even more momentum. It’s called “buying at the bottom,” and that’s a good thing.
Bottom Line
If you have questions about what’s happening with home prices, or if you’re ready to buy before prices climb higher, let’s connect.
To view original article, visit Keeping Current Matters.

Again… You Do Not Need 20% Down to Buy NOW!
A survey by Ipsos found that the American public is still somewhat confused about what is required to qualify for a home mortgage loan in today’s housing market. There are two major misconceptions that we want to address today. 1. Down Payment The survey revealed that...

Buying this Spring? Be Prepared for Bidding Wars
Traditionally, spring is the busiest season for real estate. Buyers come out in force and homeowners list their houses for sale hoping to capitalize on buyer activity. This year will be no different! Buyers have already been out in force looking for their dream homes...

The ‘REAL’ News about Housing Affordability
Some industry experts are claiming that the housing market may be headed for a slowdown as we proceed through 2017, based on rising home prices and a potential jump in mortgage interest rates. One of the data points they use is the Housing Affordability Index, as...

Consumer Confidence in Economy & Housing is Soaring
The success of the housing market is strongly tied to the consumer’s confidence in the overall economy. For that reason, we believe 2017 will be a great year for real estate. Here is just a touch of the news coverage on the subject. HousingWire: “Consumers’ faith in...

Looking to Move-Up to a Luxury Home? Now’s the Time!
If your house no longer fits your needs and you are planning on buying a luxury home, now is a great time to do so! We recently shared data from Trulia’s Market Mismatch Study which showed that in today’s premium home market, buyers are in control. The inventory of...

How Fast Can You Save for a Down Payment?
Saving for a down payment is often the biggest hurdle for a first-time homebuyer. Depending on where you live, median income, median rents, and home prices all vary. So, we set out to find out how long would it take you to save for a down payment in each state? Using...